6 Aralık 2010 Pazartesi

The JavaScript InfoVis Toolkit


When I was surfing, I found really good javascript based visualization tool. It is called "The JavaScript InfoVis Toolkit". It provides really good visualazitons in web browsers and free to use.


26 Kasım 2010 Cuma


Internet Graph

8 Kasım 2010 Pazartesi

Graph Tip for the 9th of November

How can be the visualisation of the same graph differ? If you are lucky to simplify the original graph, surely you can have better visualizations and better execution times.


31 Ekim 2010 Pazar

Graph of Today III

Romantic relationship network in US school. Blue ones are male and pink ones are female. The data is within 18 months.

26 Ekim 2010 Salı

Graph of Today II

Today's graph is based on the orthogonal layout. Interstingly, a biological notation called MIM notation requires circuitwise drawings. In my recent project, we use OGDF's orthogonal layout and obtained following figure.


25 Ekim 2010 Pazartesi

Graph of Today

Today I was looking brand new graph libraries and I see NetwokX. It is nice with really good visuals. The base language is python and makes it easier to understand and develop.

Here is the nice example

21 Temmuz 2010 Çarşamba

Big Talk

Some sayings that were tragic for owners although they were really intelligent. It is better sometimes to be, "Think a lot, speak less" :)

English: "Computers may just be 1.5 tons in the future"
Turkish: "Bilgisayarlar gelecekte belki sadece 1,5 ton ağırlığında olacaklar."

Popular Mechanics Journal, 1949

English: "There is no reason for any individual to have a computer in his/her home"
Turkish: "İnsanların evlerinde bilgisayar bulundurmaları için herhangi bir neden göremiyorum."

Kenneth Olsen, Digital Equipment Corp Head, 1977

Long time without post

It has been a long time until my last post except today's post. I can not beleive how the time passes so fast. What I have done; I and my ex-advisor sent our revision of the journal paper. In one of my attended course of Prof. Turkan Haliloglu, we also tried to propose a metric to differentiate native and design 3d complex structures. We submitted a kind of hybrid scoring methodology. Furthermore, with my Phd advisor, we also work on another project to detect dense modules in MIMs. Finally, we also try to code a tool named PROLiVis(PROtein protein interaction Literature Visualization).

Also, with my family, we spent one week holiday at southwest of Turkey that is a motivation for the forthcoming researches.

STRING Protein Protein Interaction Database

I am very keen on having a research over PPI networks and their visualization. Recently, I look at STRING database and I see that they have some nice visulizations using just browser api. Indeed you can also query your protein(s).
In order to have querry for the interaction visulization you just change browser adress bar text. For example,

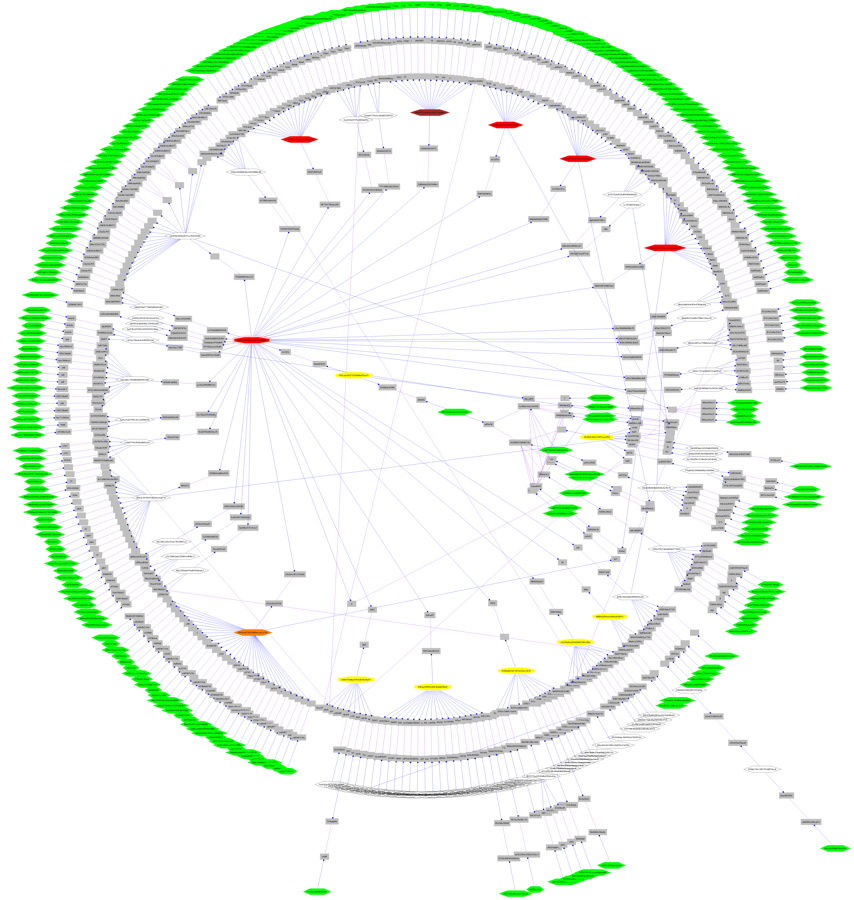
http://string-db.org/api/image/network?identifier=4932.YML115C&
required_score=950&network_depth=2&limit=10&network_flavor=evidence

returns you


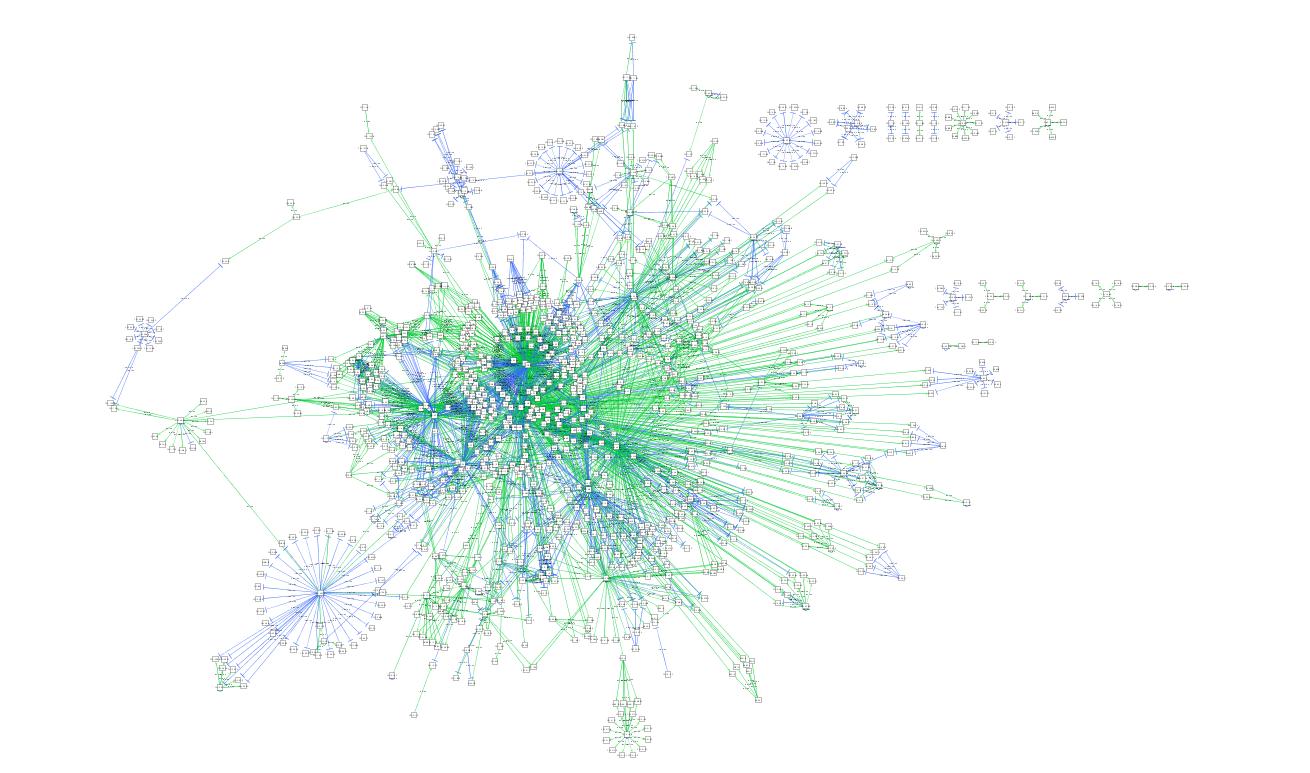
If you change the "network_depth=2" to "network_depth=3", then,


Simply you can see interaction neighborhood of any protein using correct naming and id.

18 Mayıs 2010 Salı

Protein Protein Interaction Visualization

An interesting java applet based on force directed layout is published in journal and its applet is available at http://www.charite.de/bioinformatics/interaction/yeast.html

5 Mayıs 2010 Çarşamba

4 Mayıs 2010 Salı

3 Mayıs 2010 Pazartesi

2 Mayıs 2010 Pazar

Graphviz - Command Line

Today I would like to mention about graphviz command line in windows XP.

You can use each binary executable at \bin folder. For example for dot.exe and given input.gv file, you can produce pdf,png,jpg outputs as follows;

PNG : dot -Tpng input.gv -o out.png
JPG : dot -Tjpg input.gv -o out.jpg
PDF : dot -Tpdf input.gv -o out.pdf

This is useful since you can easily show your random graphs in hierarchical layout.

27 Nisan 2010 Salı

Friendship Network in a US School


I don't know is this network true but it is also used in publications that surely makes it true. Interesting separation between green and white nodes visualized well. There are four main communities of friends in school. Also there are alone nodes which means they do not have any friends unluckily.

Interesting Layouts

25 Nisan 2010 Pazar

Semaspace: A tool for network visualization

I was surfing couple of minutes ago, and by coincidence I see this tool that has nice visualizations.

http://vis.mediaartresearch.at/webarchive/public/view/mid:30

Their source code is available.

Some nice screens from their website


23 Nisan 2010 Cuma

Interesting Layouts


Dynamic Graph and its application link

What is PI?


3.14159265358979323846264338327950288...

22 Nisan 2010 Perşembe

21 Nisan 2010 Çarşamba

Interesting Layouts


Nodes are drawn on a circle. Each circles have different density of edges.

20 Nisan 2010 Salı

Interesting Layouts


Visualization of 15 minutes of log data for a class B firewall, with and without background worm traffic using aiSee tool.

And also you should also check these, about visualization of social networks.

10 Nisan 2010 Cumartesi

8 Nisan 2010 Perşembe

7 Nisan 2010 Çarşamba

Interesting Layouts - 1

I am trying to give names to the graphs as far as I posted, but in some cases it is really hard to name the graphs. Since the topic of this blog covers "graph days" and "graph layouts", from now on I will start new series of posts as "Interesting Layouts". Here is the first one;


(Hopefully, I expect that these referenced links will not expire in the future)