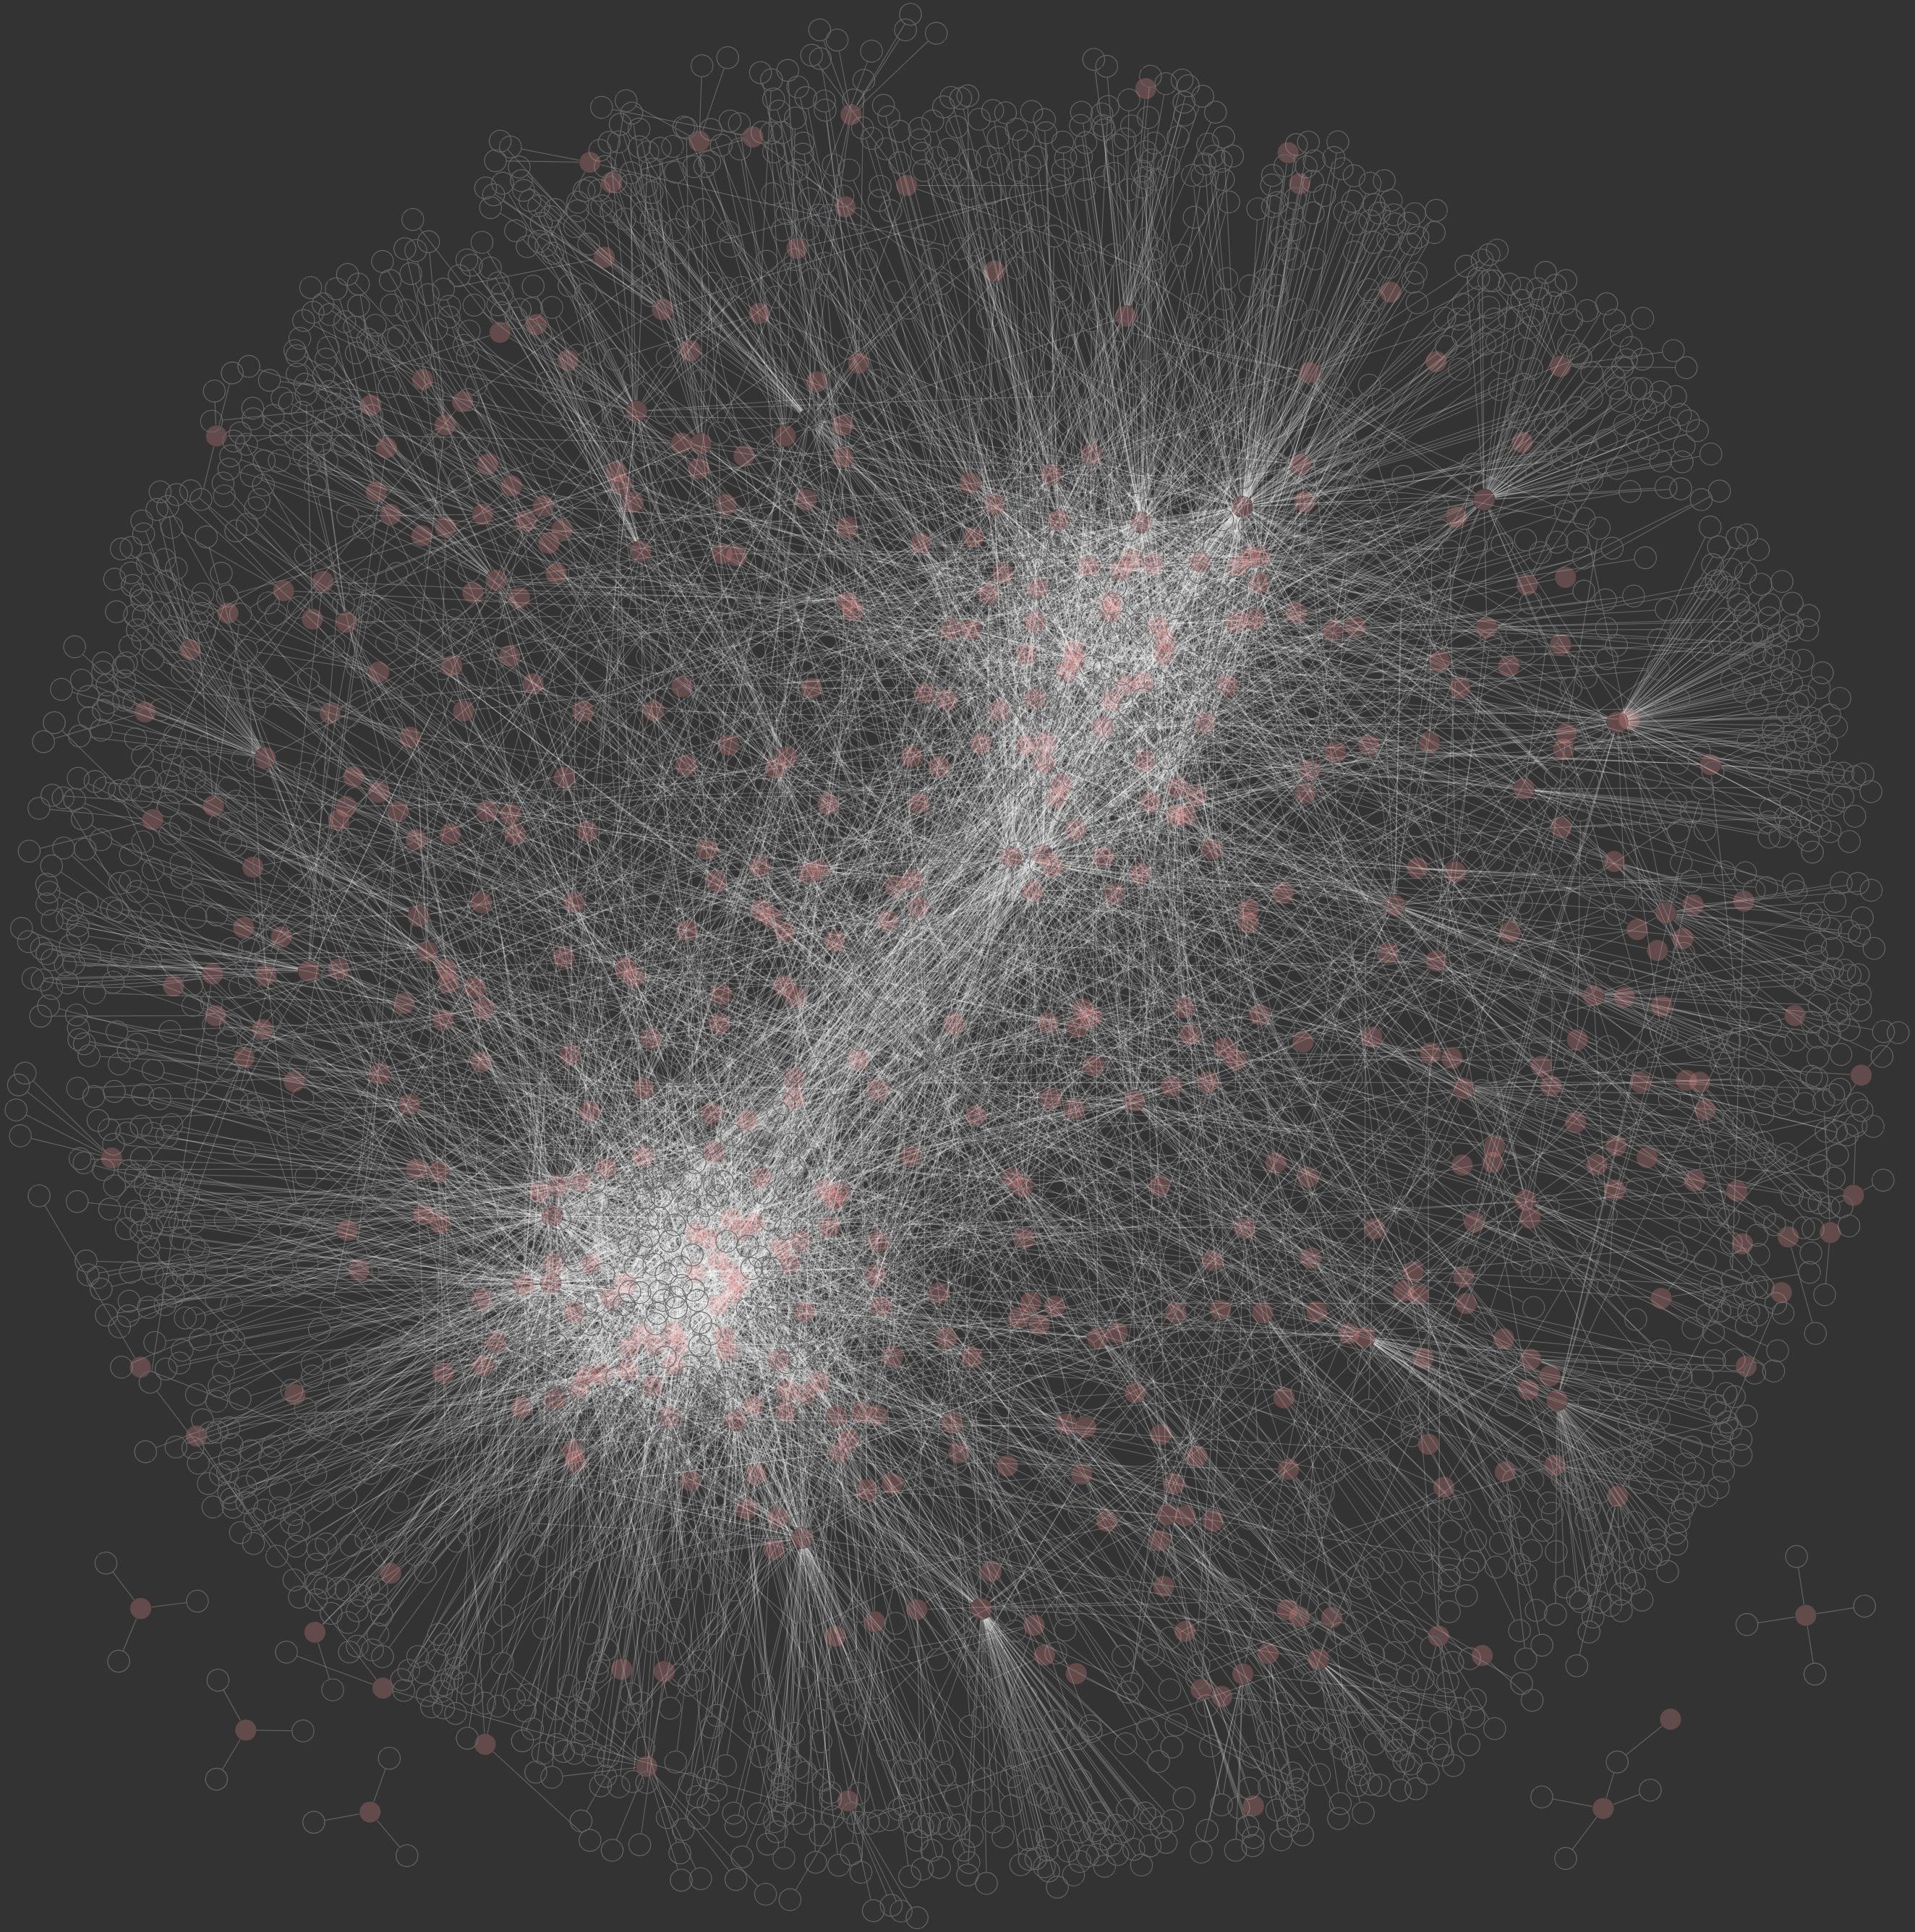
When I was surfing, I found really good javascript based visualization tool. It is called "The JavaScript InfoVis Toolkit". It provides really good visualazitons in web browsers and free to use.
How can be the visualisation of the same graph differ? If you are lucky to simplify the original graph, surely you can have better visualizations and better execution times.