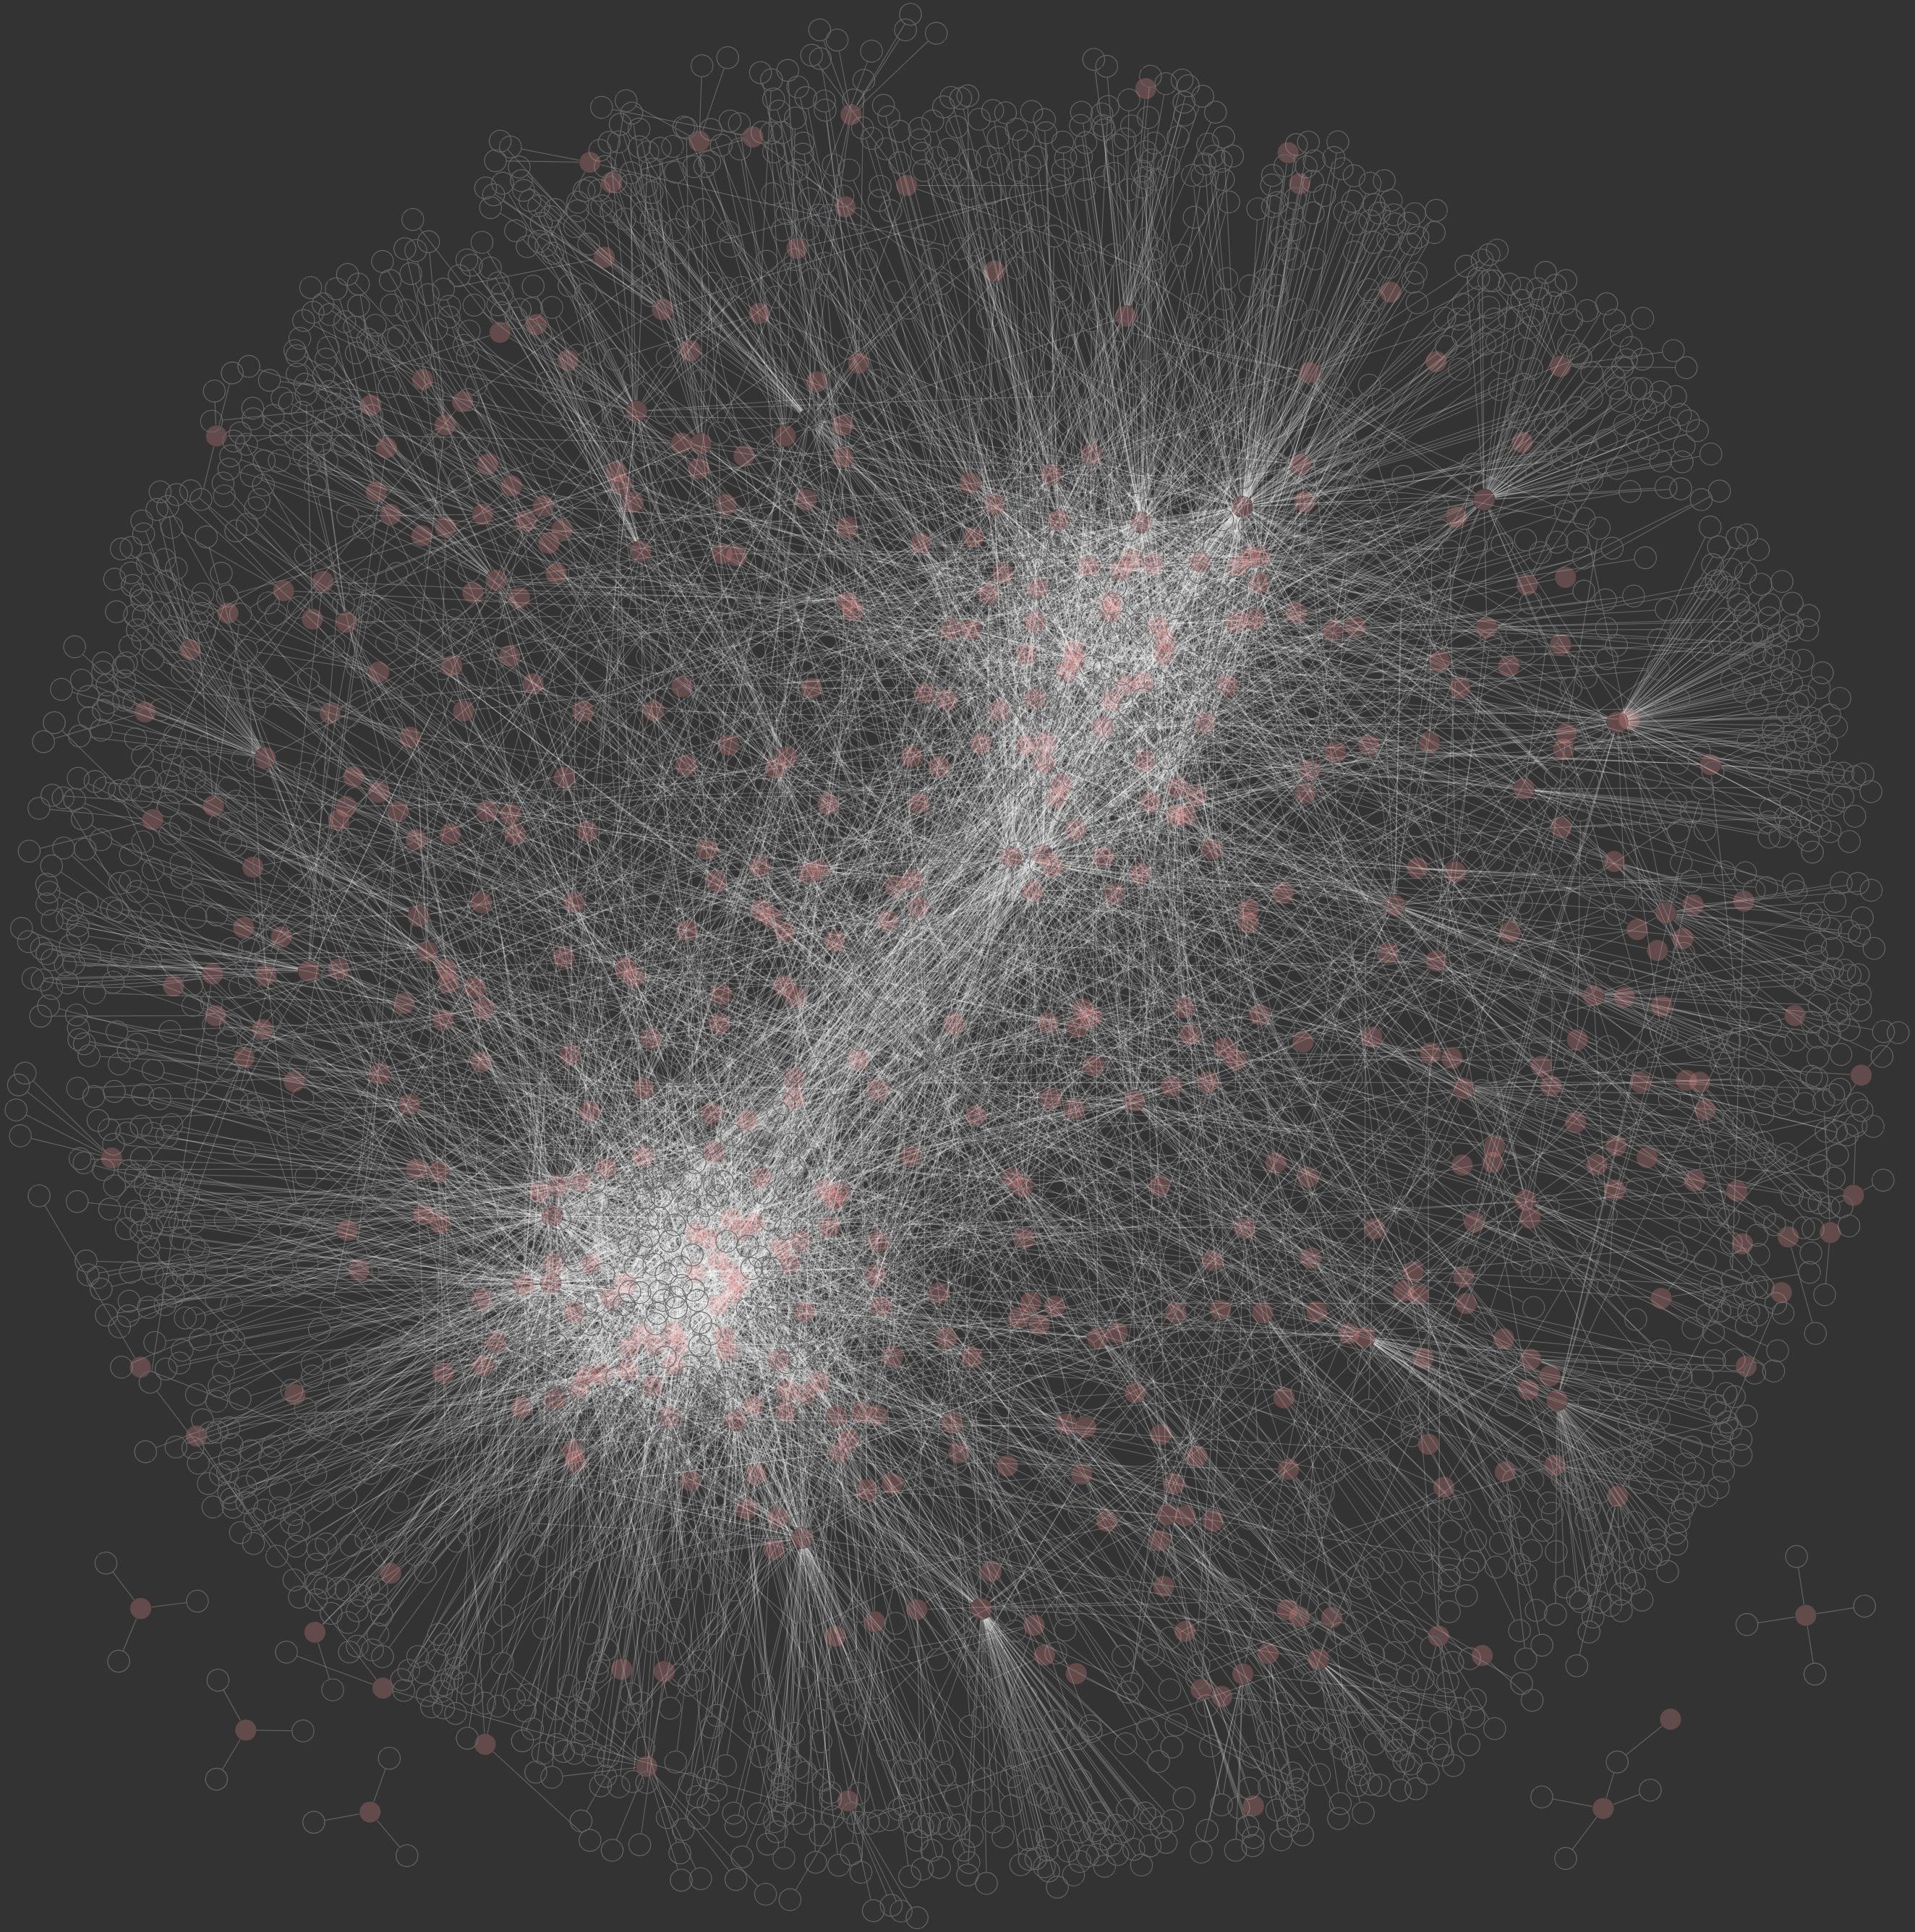
Recently, with the increasing interest on web based applications Javascript has born again. With HTML 5 standards, web developers can do even 3D games using browsers capabilities. Protovis is a kind of javascript library to produce nice visualizations. You can visualize your data with many options. You can also adopt arc drawing, force directed drawings, radial drawings to your input graphs.
Here are some snapshots from this library: